In this section, you will explore the integrated visibility and monitoring capabilities of the platform. Specifically, you will explore the dashboards that provide you access to both critical summary and trends.
- You will start with a “bird’s eye view” and contextually click in one level at a time, going deeper and deeper.
- Critical metrics are automatically scraped and aggregated at the controller in a centralized time series database (TSDB)
- Interactive, real time access to this data is provided
Estimated Time
Estimated time burden for this part is 5 minutes.
This part requires the monitoring addon to be enabled in the cluster blueprint.
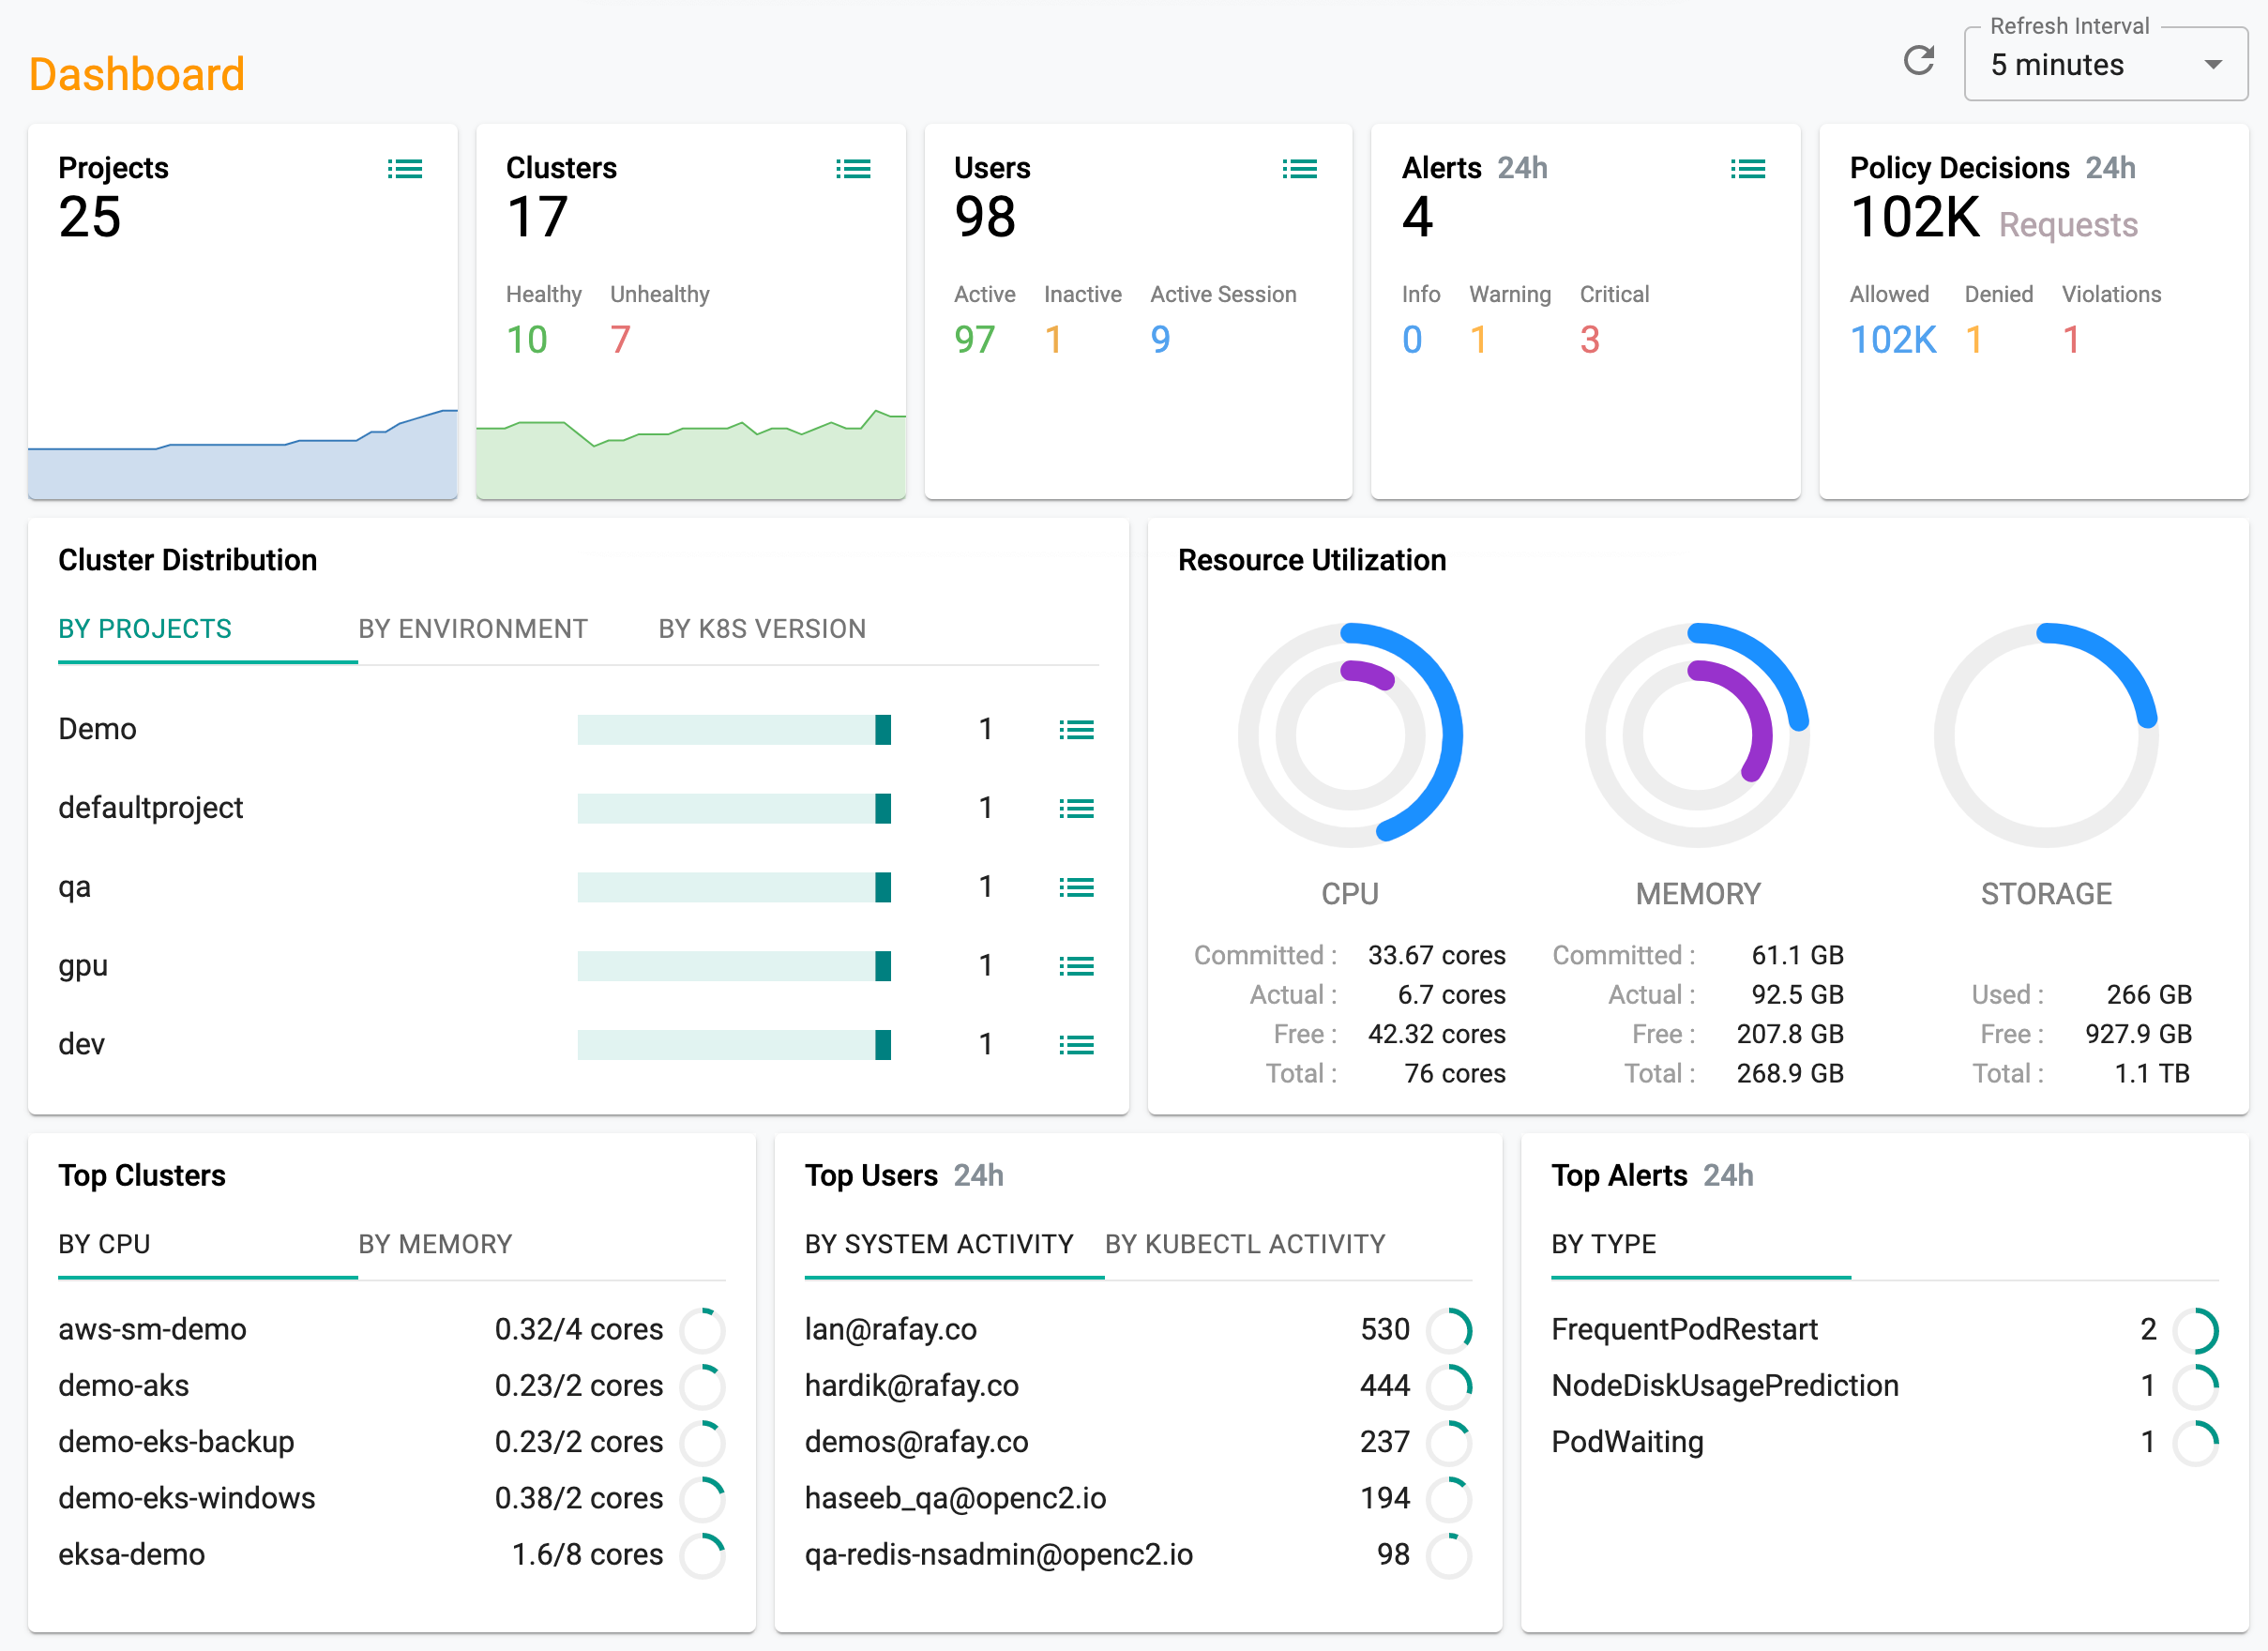
Org Dashboard
Click on Home -> Dashboard to view all clusters, projects, user activity, resource utilization and events in the Project. You should see something like the example below.
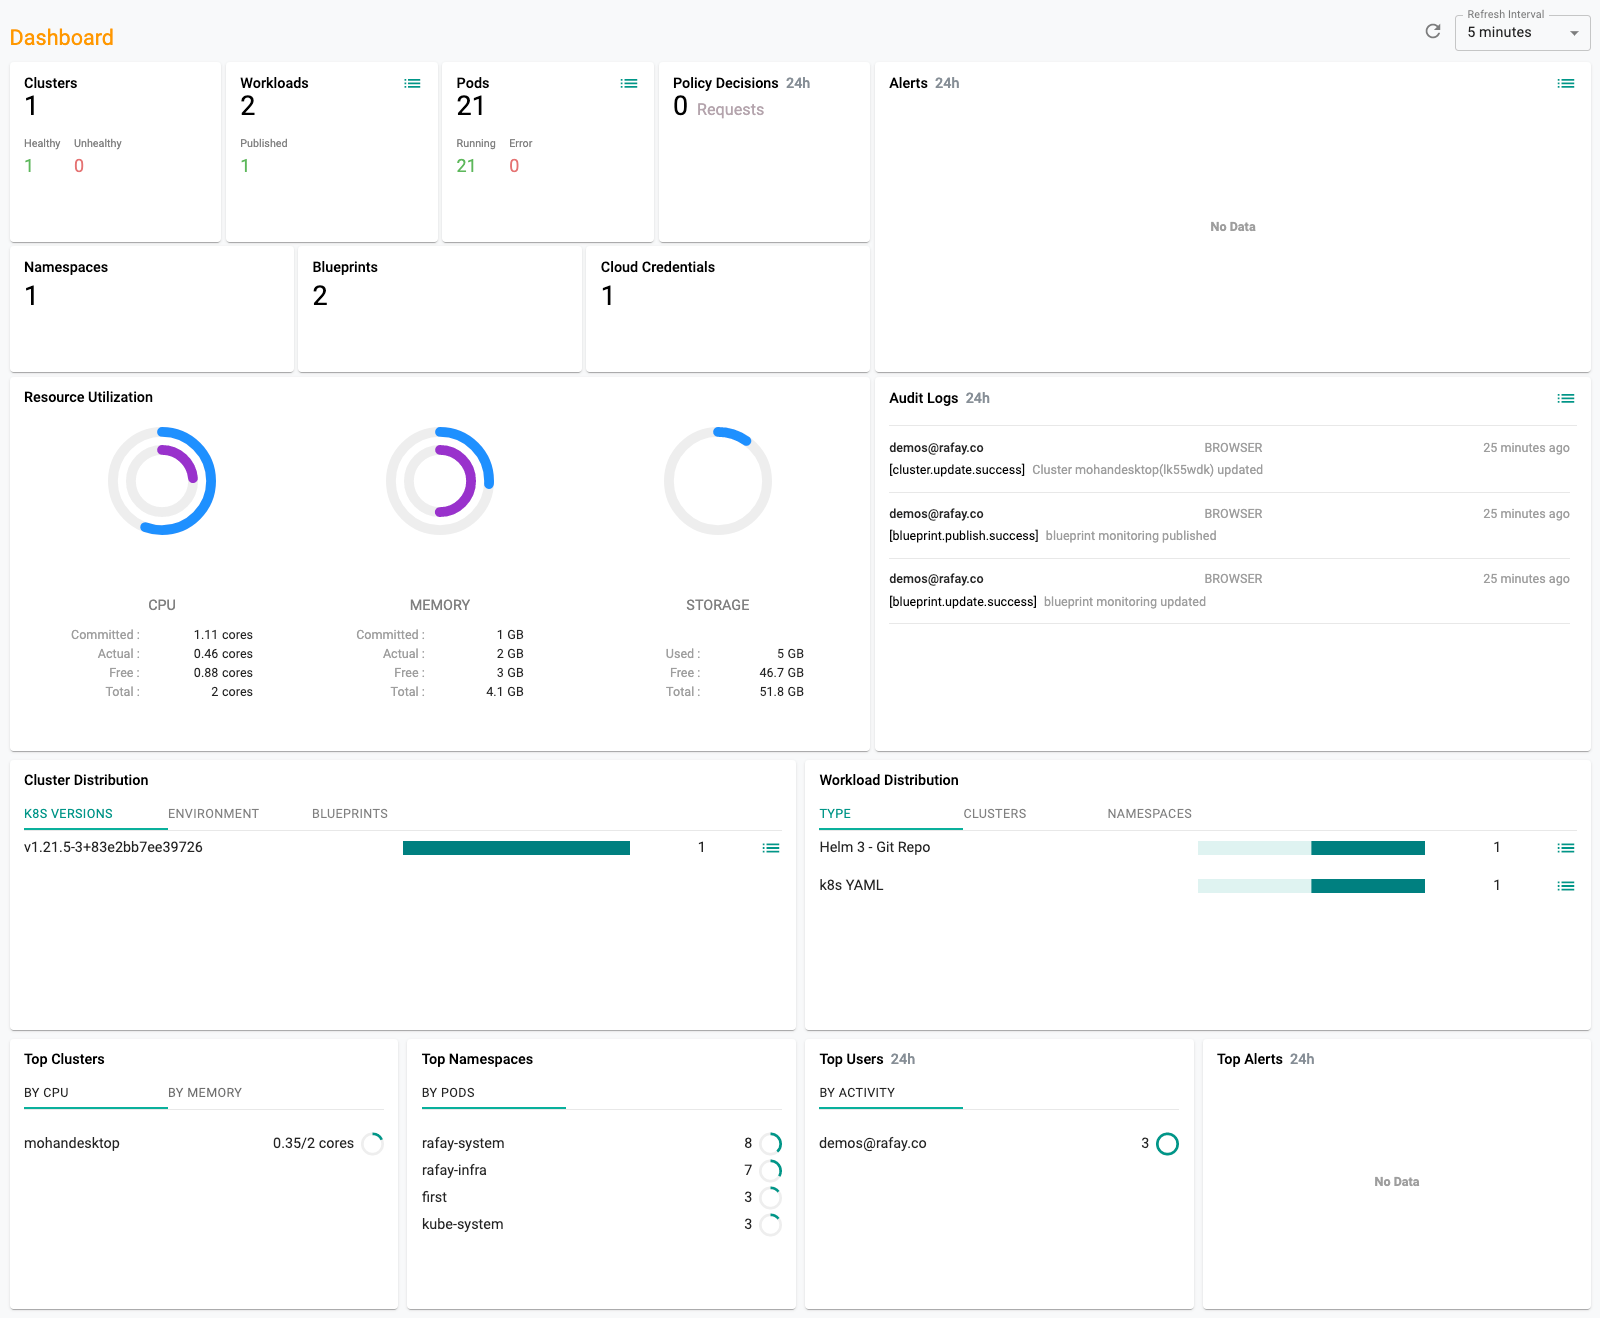
Project Dashboard
Select a Project and Click on Dashboard to view all clusters, projects, user activity, application, workloads and events across the entire Project. You should see something like the example below.
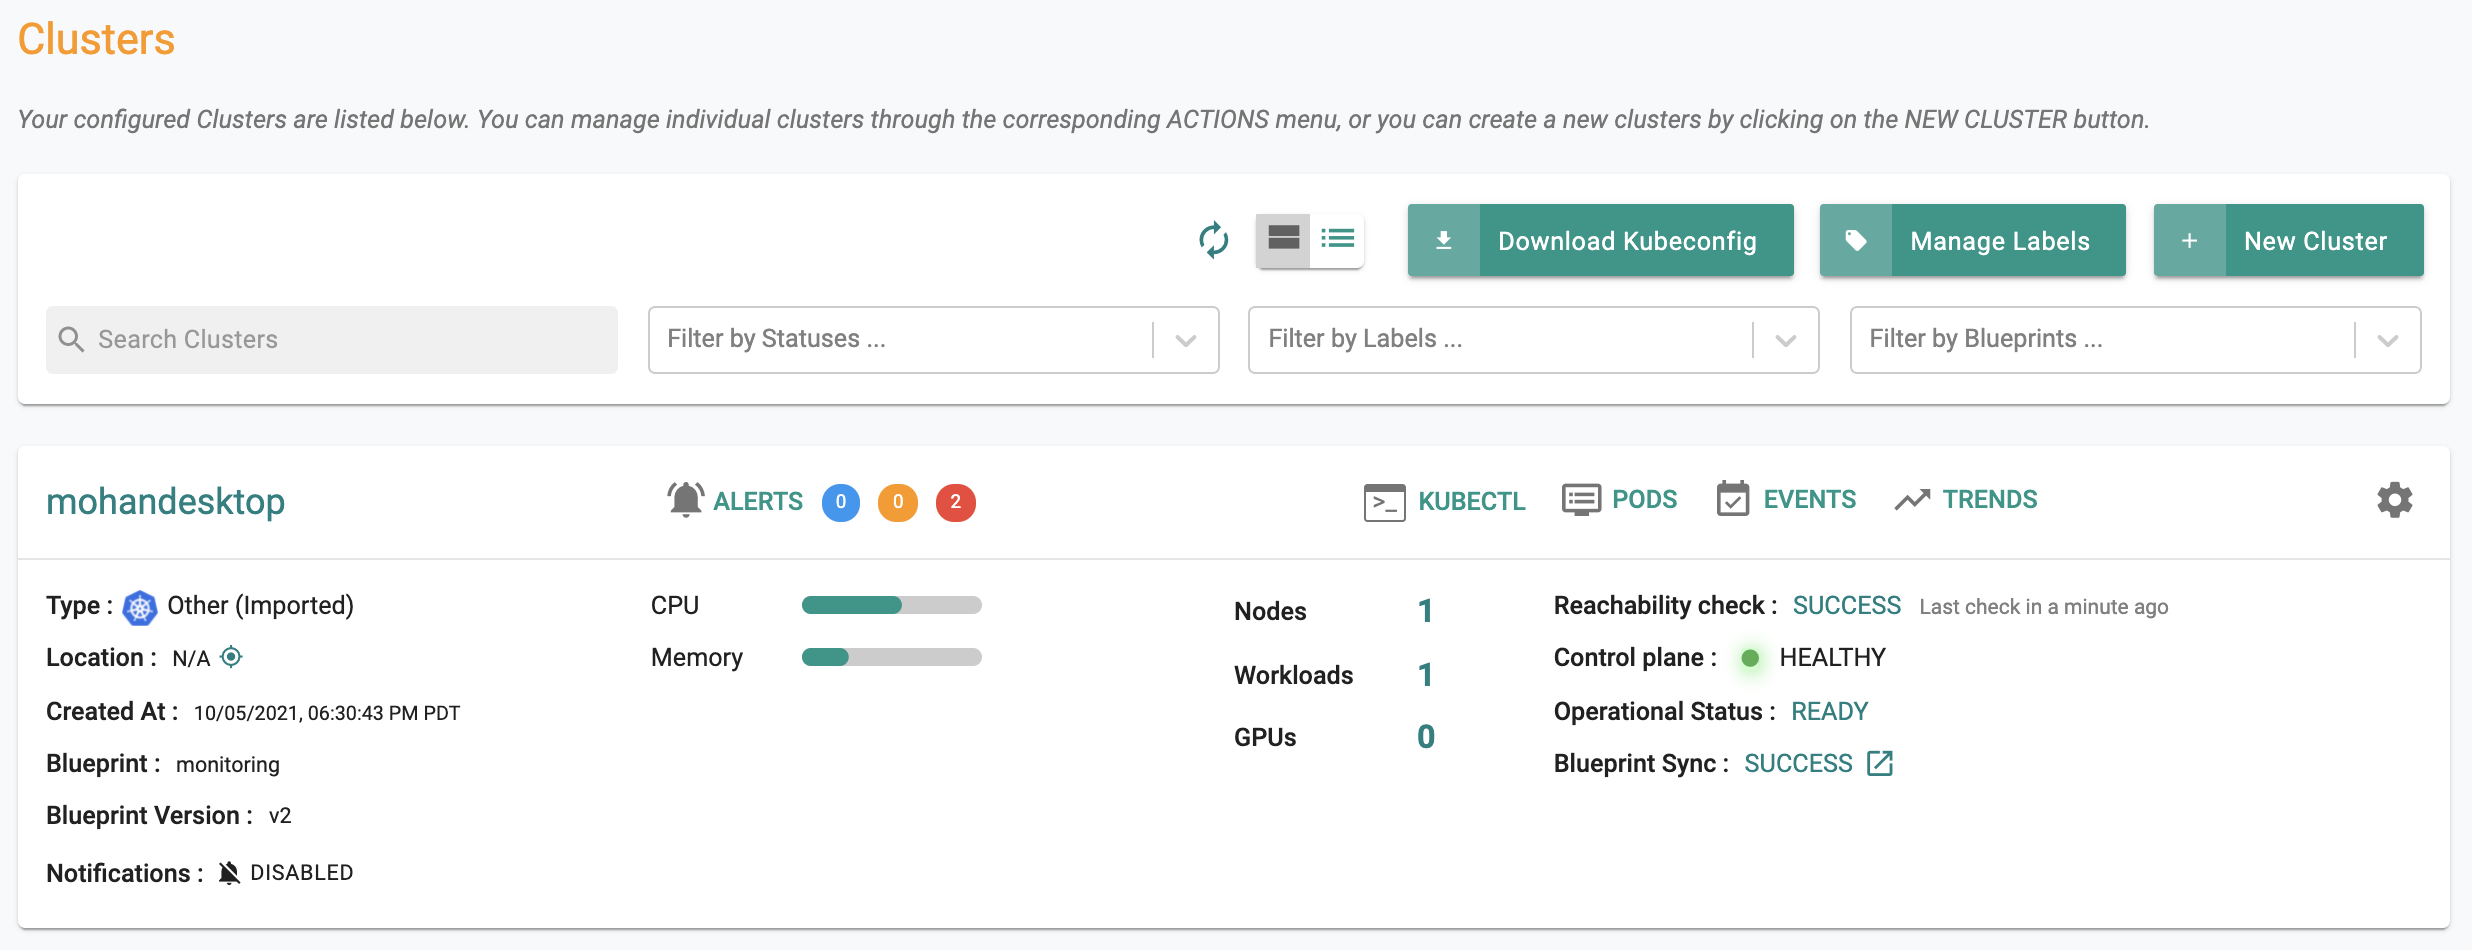
Cluster Dashboard
In your project, click on Infrastructure -> Clusters. You should see something like the example below providing an overview of critical, operational metrics for your cluster.
Node Dashboard
In the cluster dashboard, click on Nodes. This will provide you an overview of all the nodes in the cluster. You should see something like the example below.
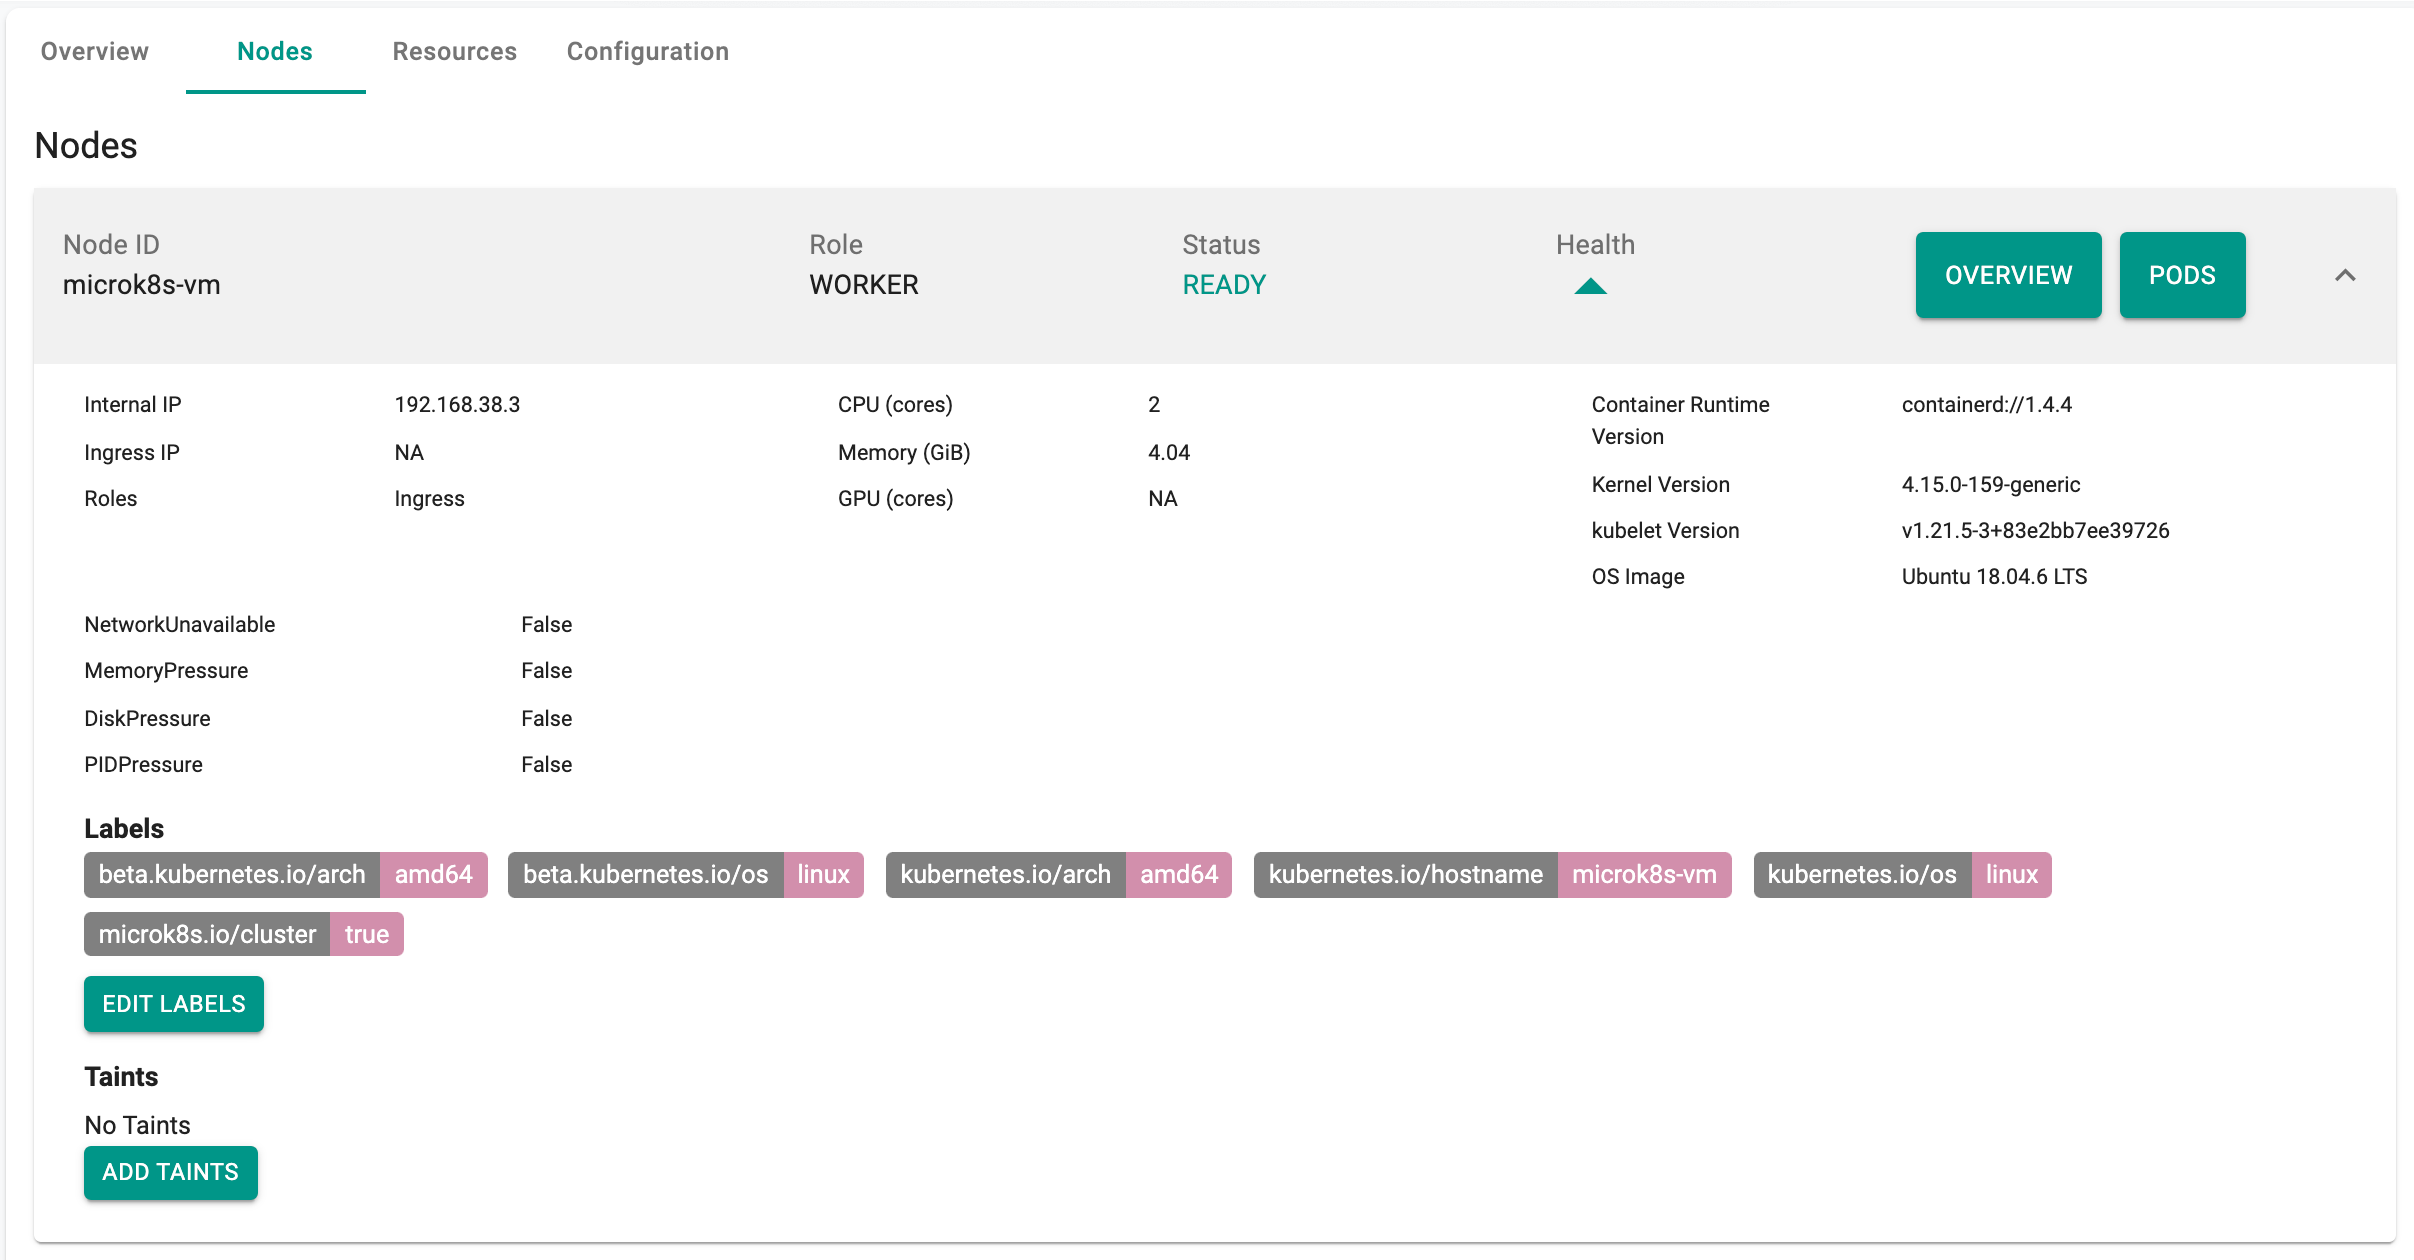
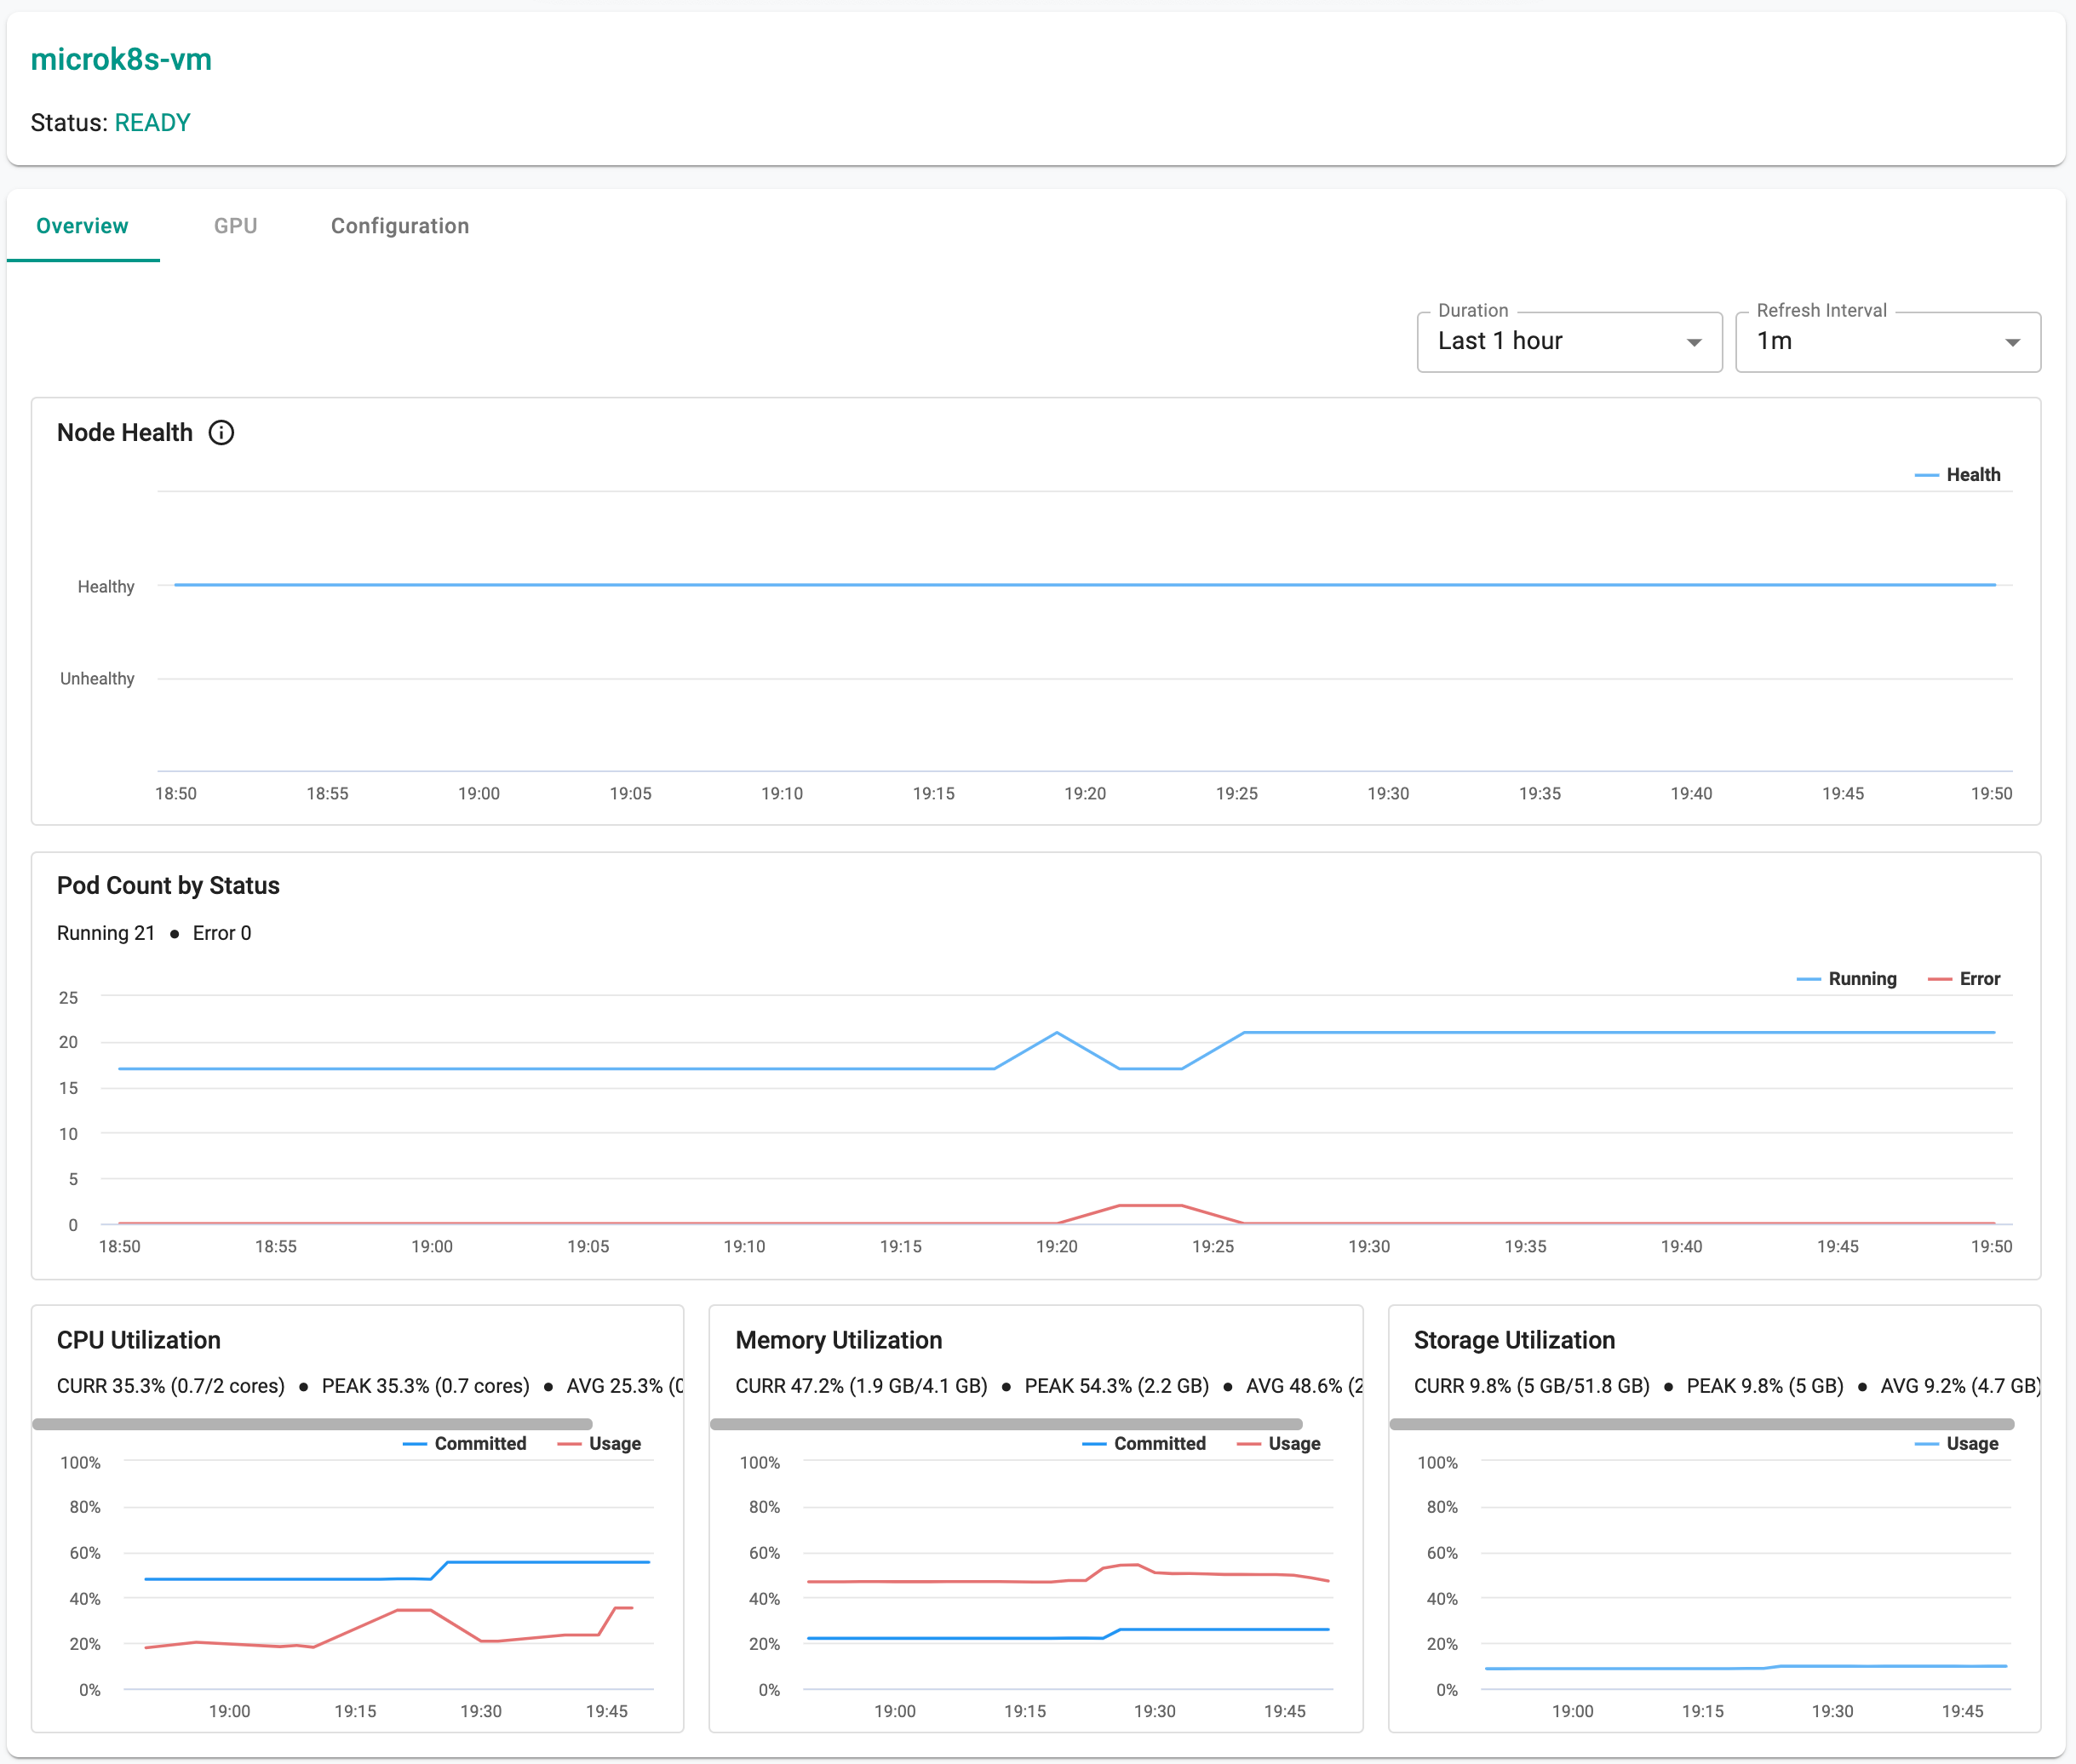
Click on Overview for one of your nodes. This will provide you with a dashboard for the node.
k8s Resources
Click on the Resources tab. This will provide you access to an integrated Kubernetes dashboard where you can view the k8s resources organized by type, by namespace etc.
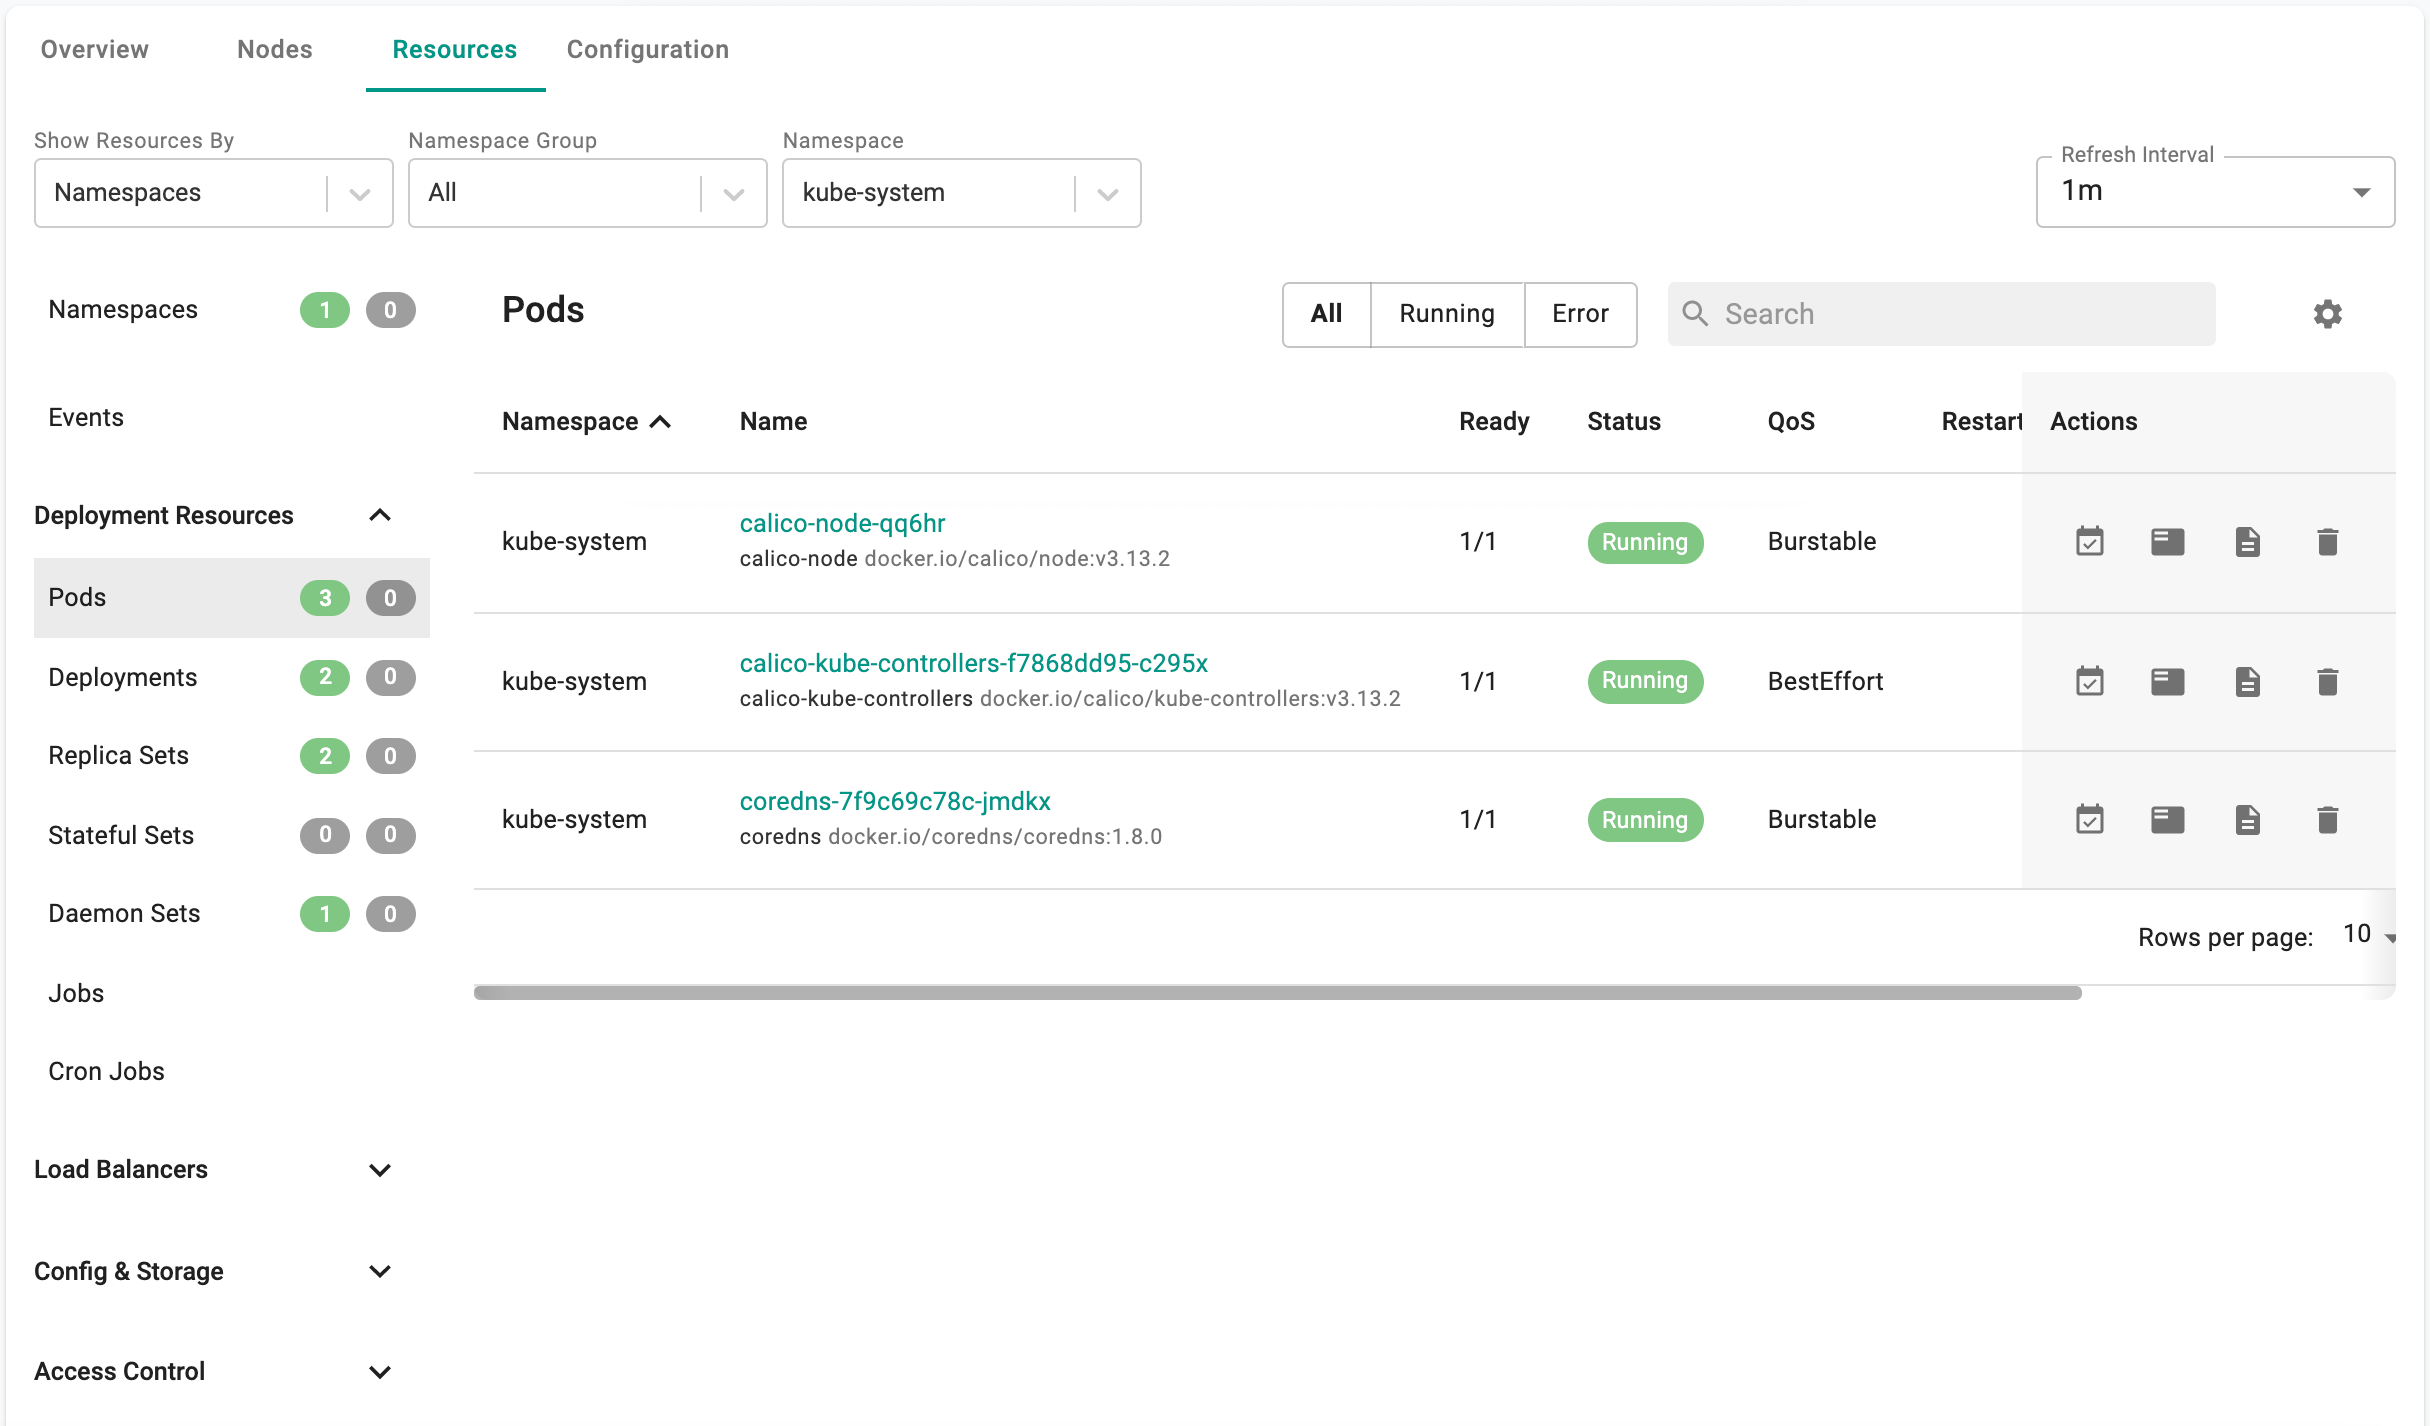
Pod Dashboard
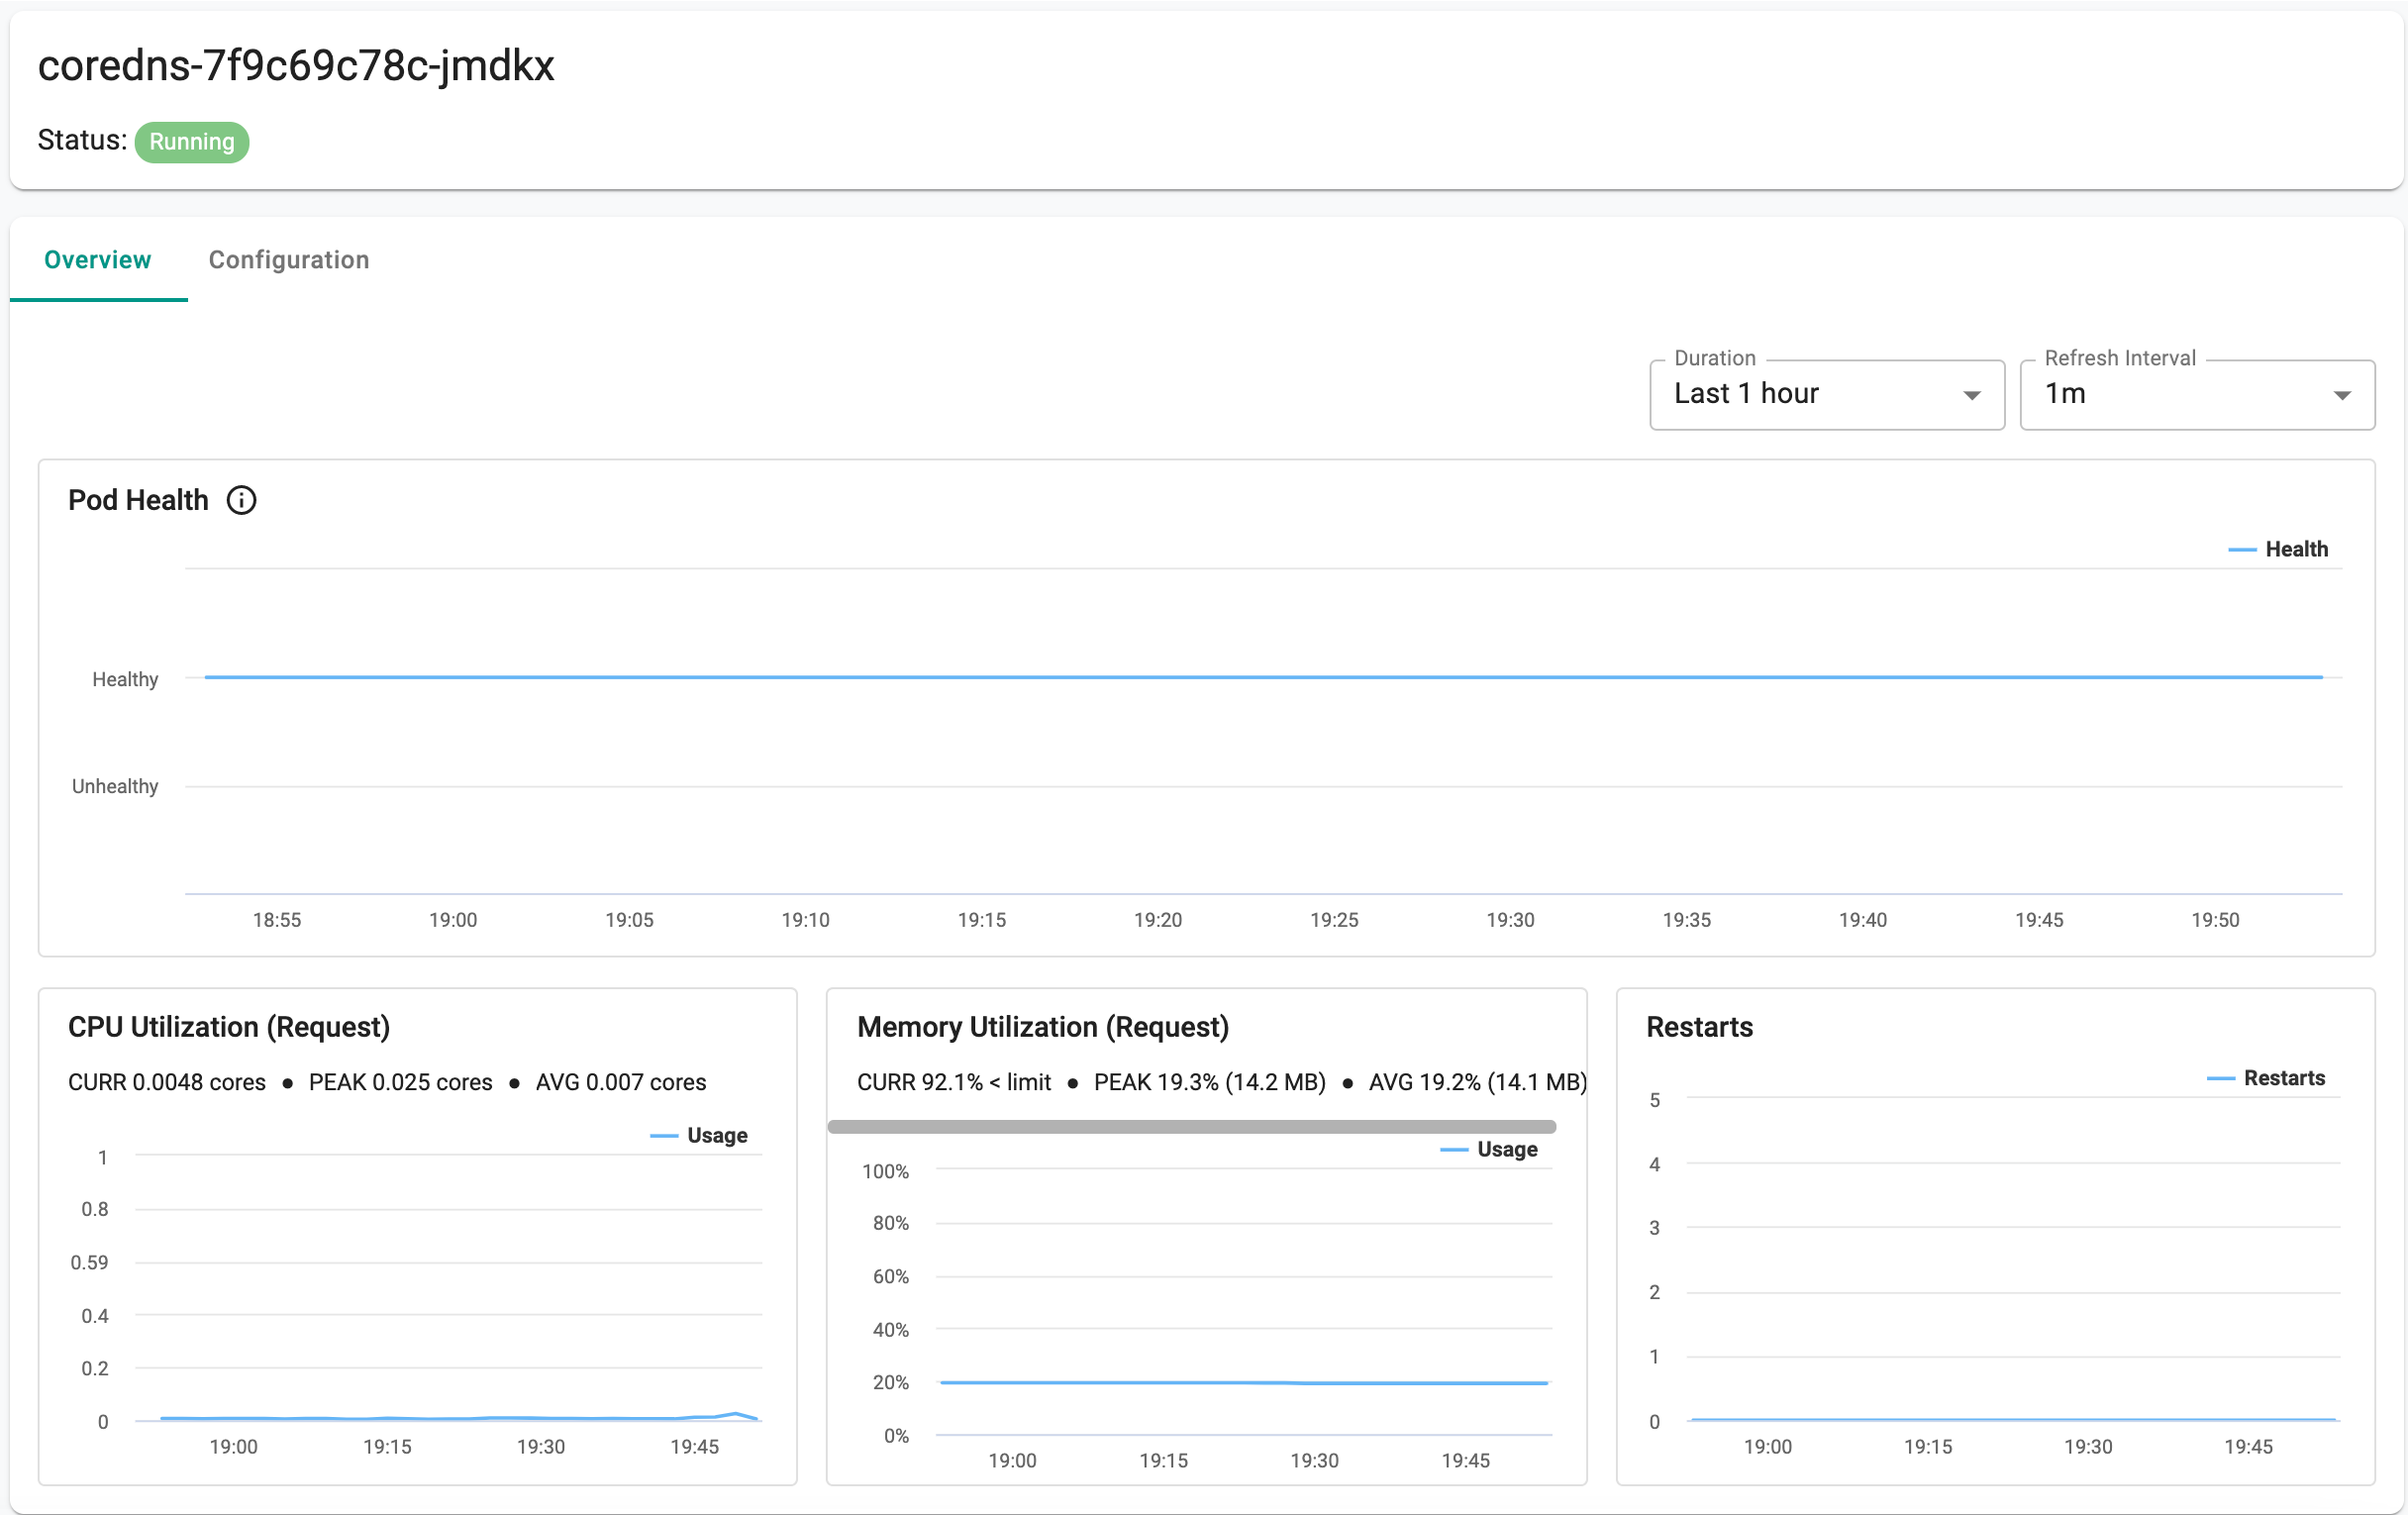
By default, the k8s dashboard will list the pods in the “kube-system” namespace. Click on the “coredns” pod to view the Pod dashboard. You should see something like the example below.
Container Dashboard
Click on “Configuration” for the pod in the pod dashboard
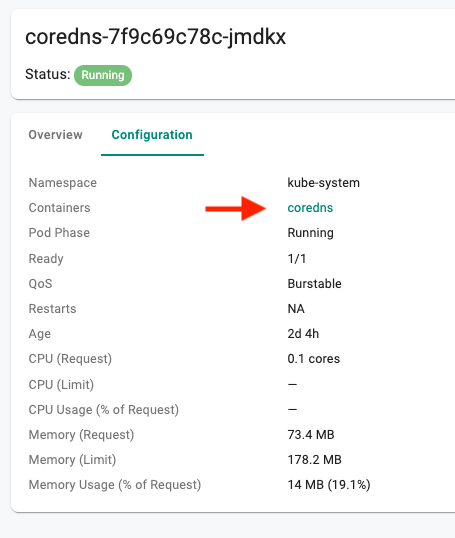
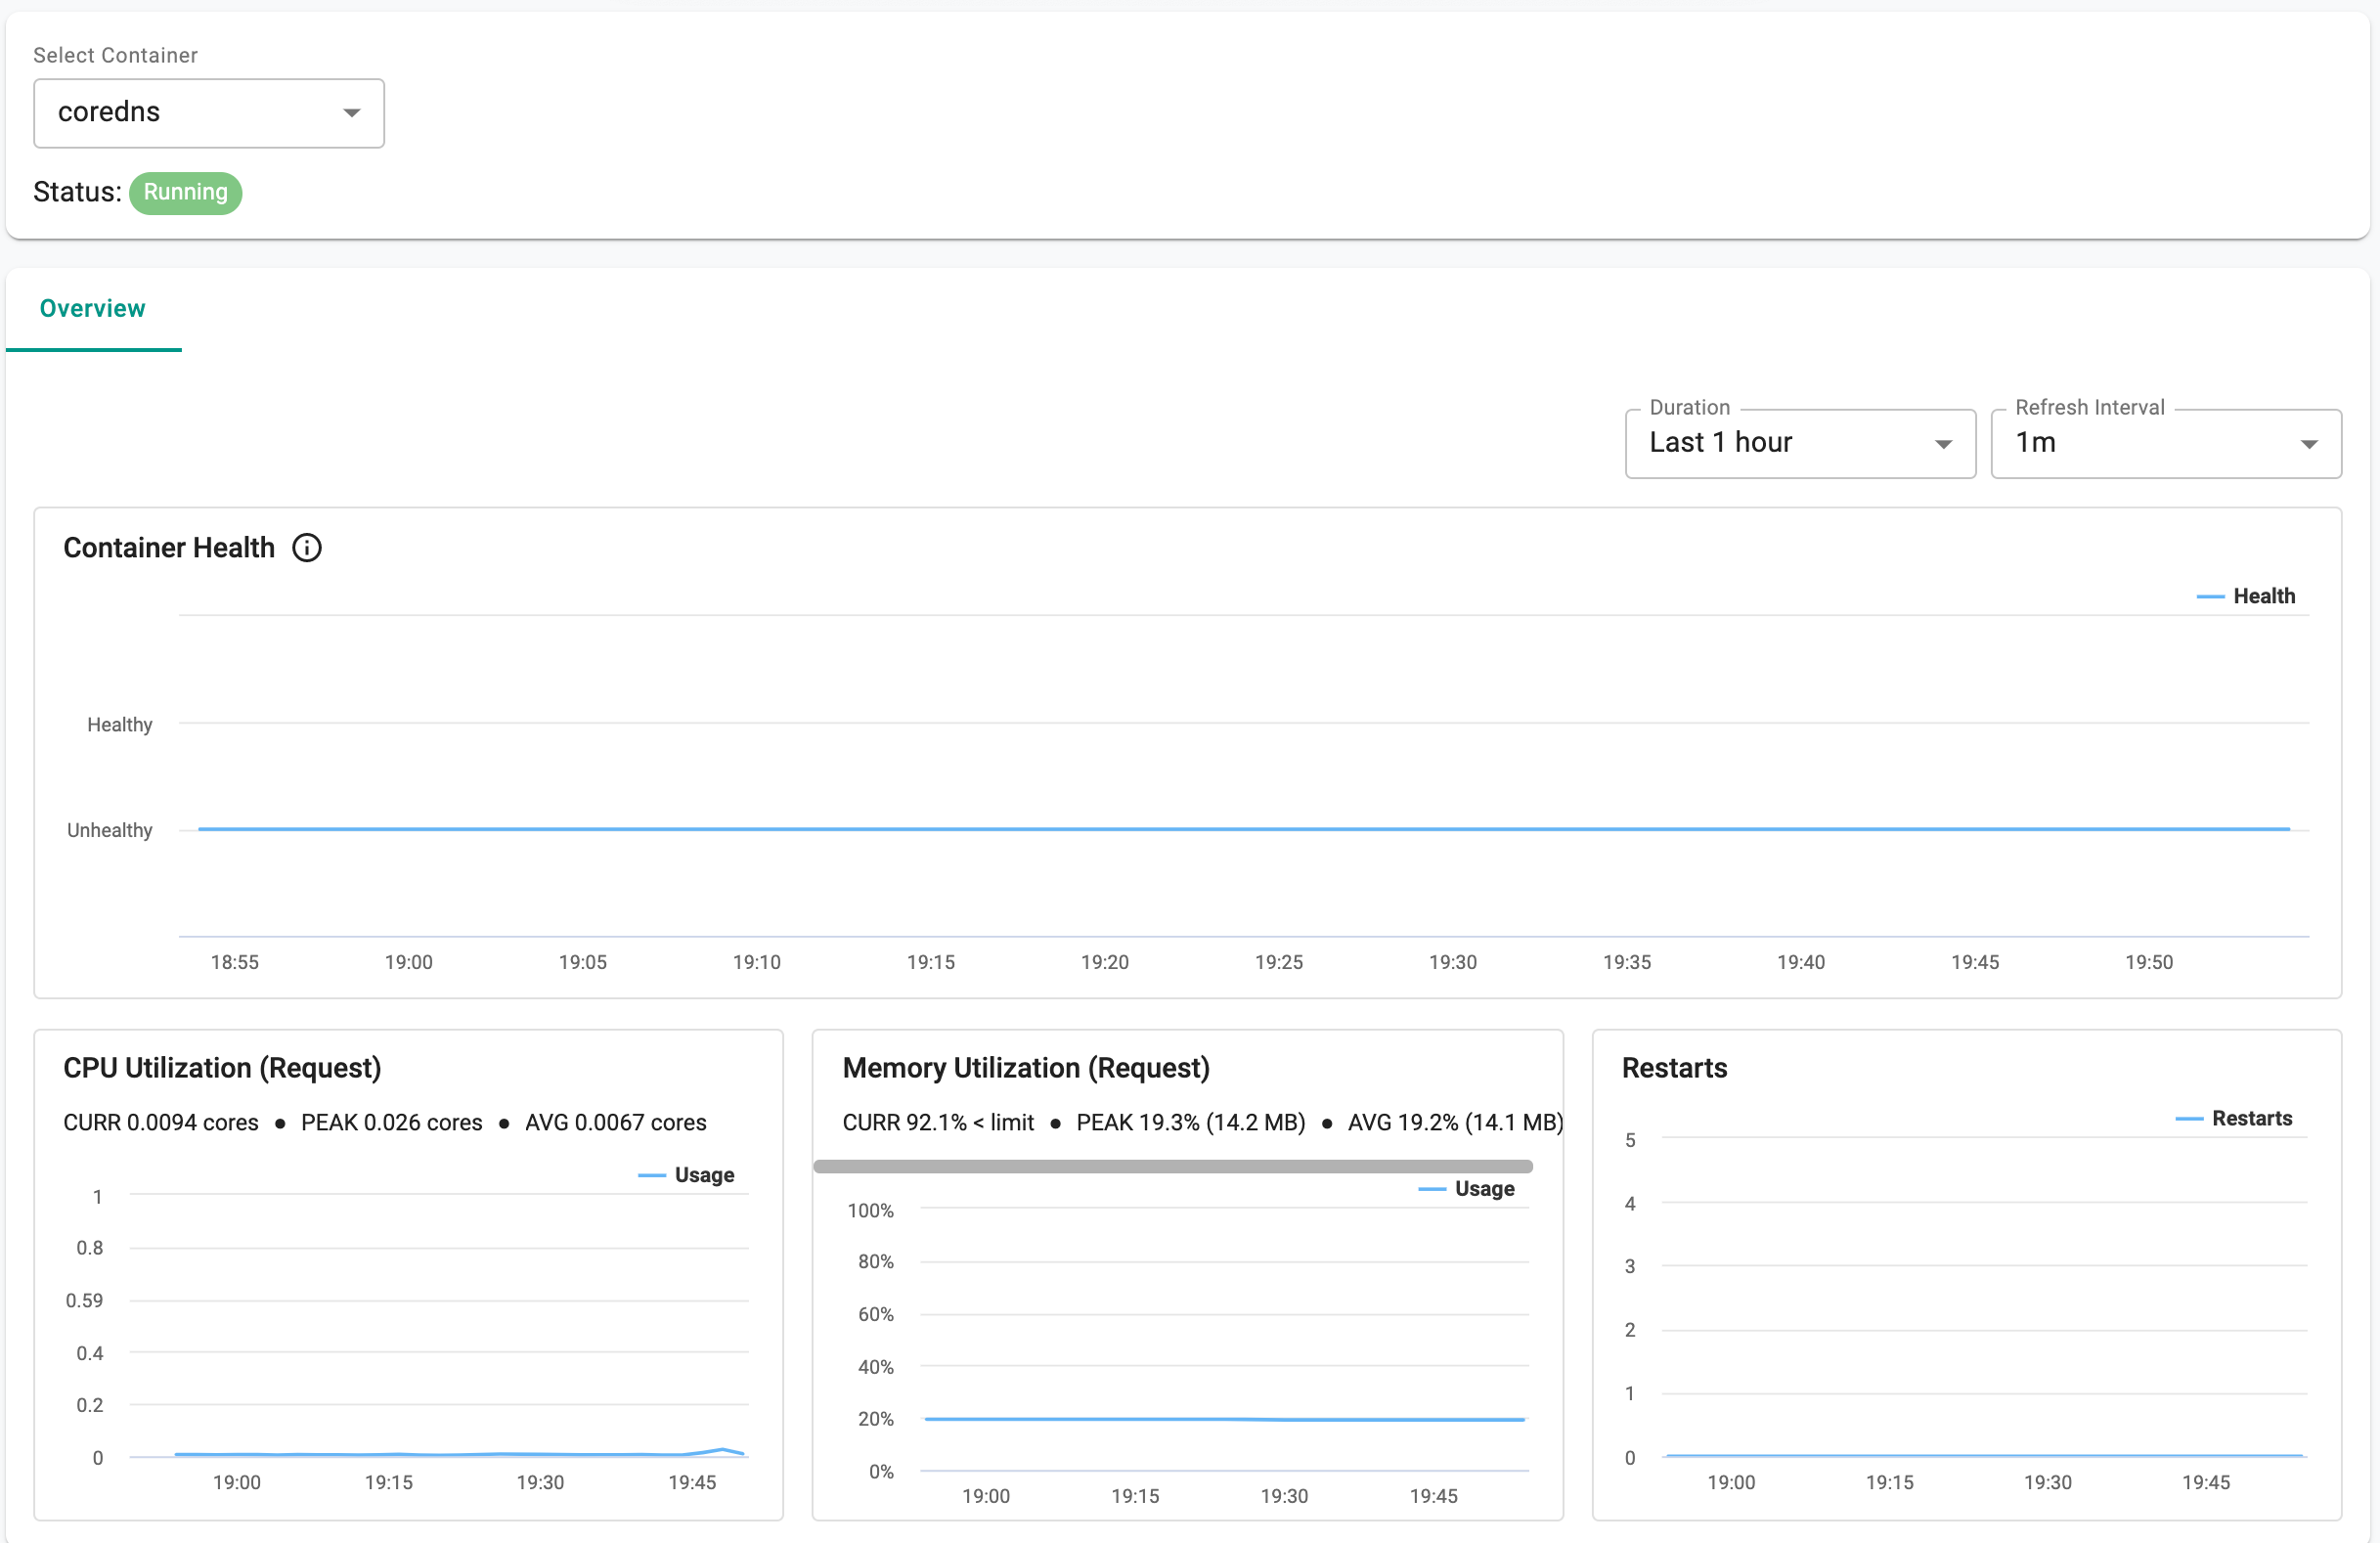
Now, click on the container in the configuration to go to the “container dashboard”. You should see something like the example below.
Recap
Congratulations! At this point, you have successfully accessed the integrated dashboards for visibility and monitoring. <!– TODO: Rafay team - replace “have successfully accessed the integrated dashboards for visibility and monitoring” with more specific results smth like learned how to address problem 1 and 2 with Rafay dashboards and you can use this knowledge to solve more problems (link to some do with use cases) using those capabilities…